August 5, 2026
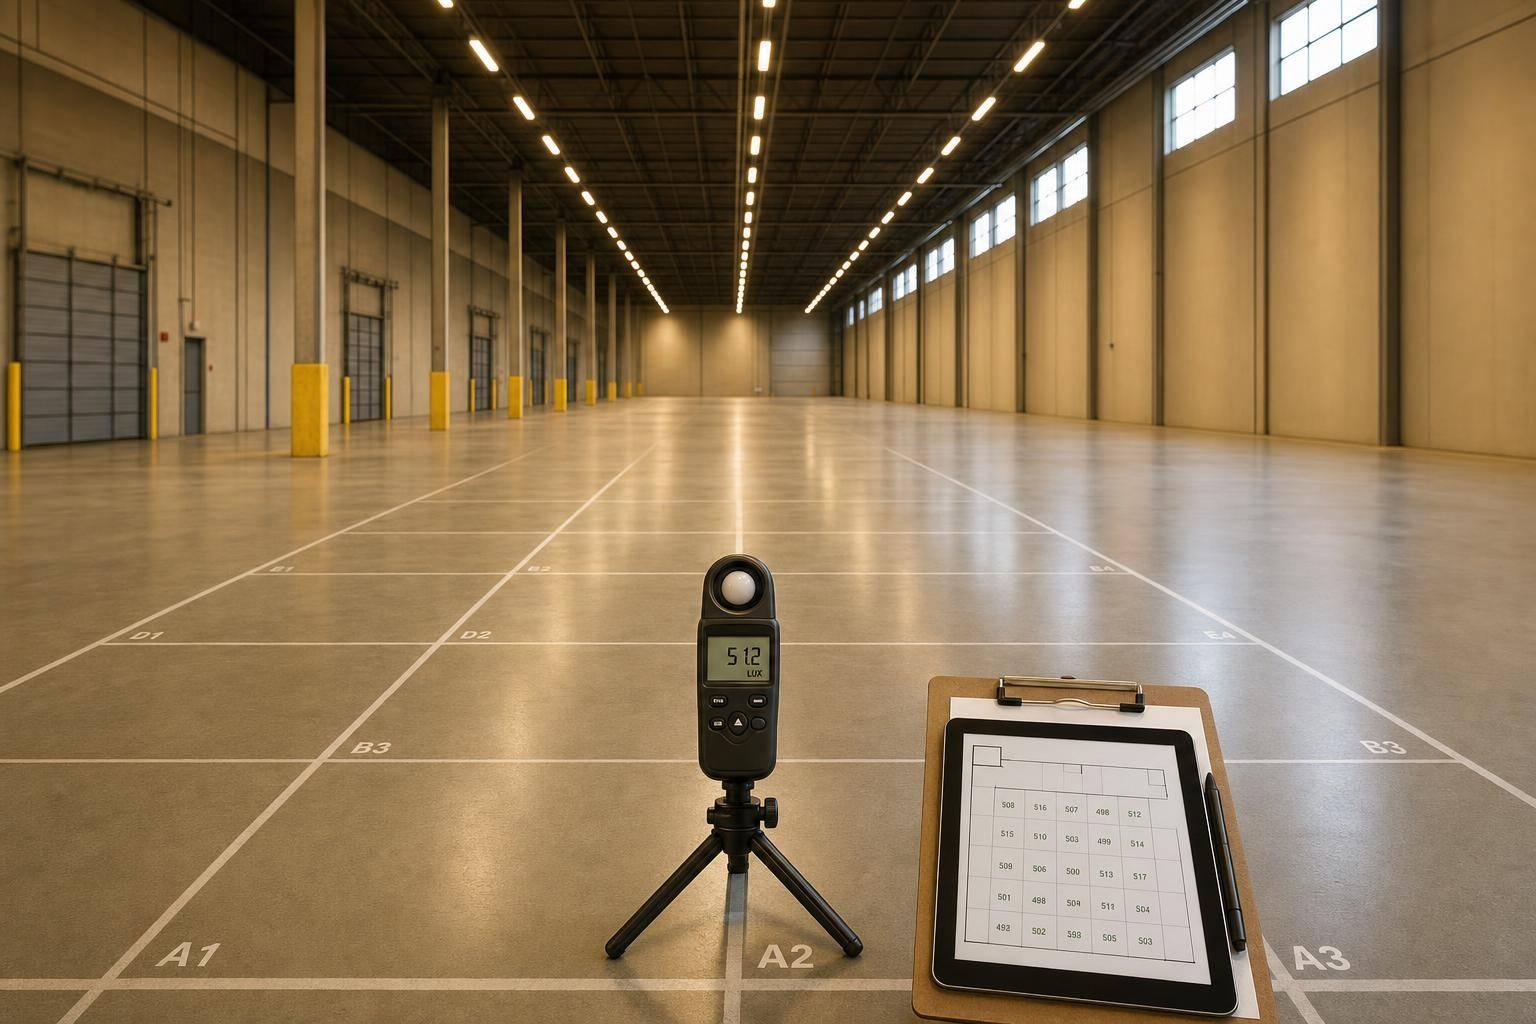
A lighting site assessment should do one thing first: give you clean baseline data before you buy or install LED fixtures. If I skip that step, I risk bad light levels, bad savings math, and a project budget that does not match the site.
Here’s the short version:
That matters because lighting retrofits are not just about cutting watts. The article points out that interior LED upgrades can trim lighting electricity use by about 37%, but only if the scope, hours, and controls are based on what the building is actually doing.
A good assessment gives me the numbers I need for fixture choice, payback, rebates, and approval. A weak one leaves too much to guesswork.
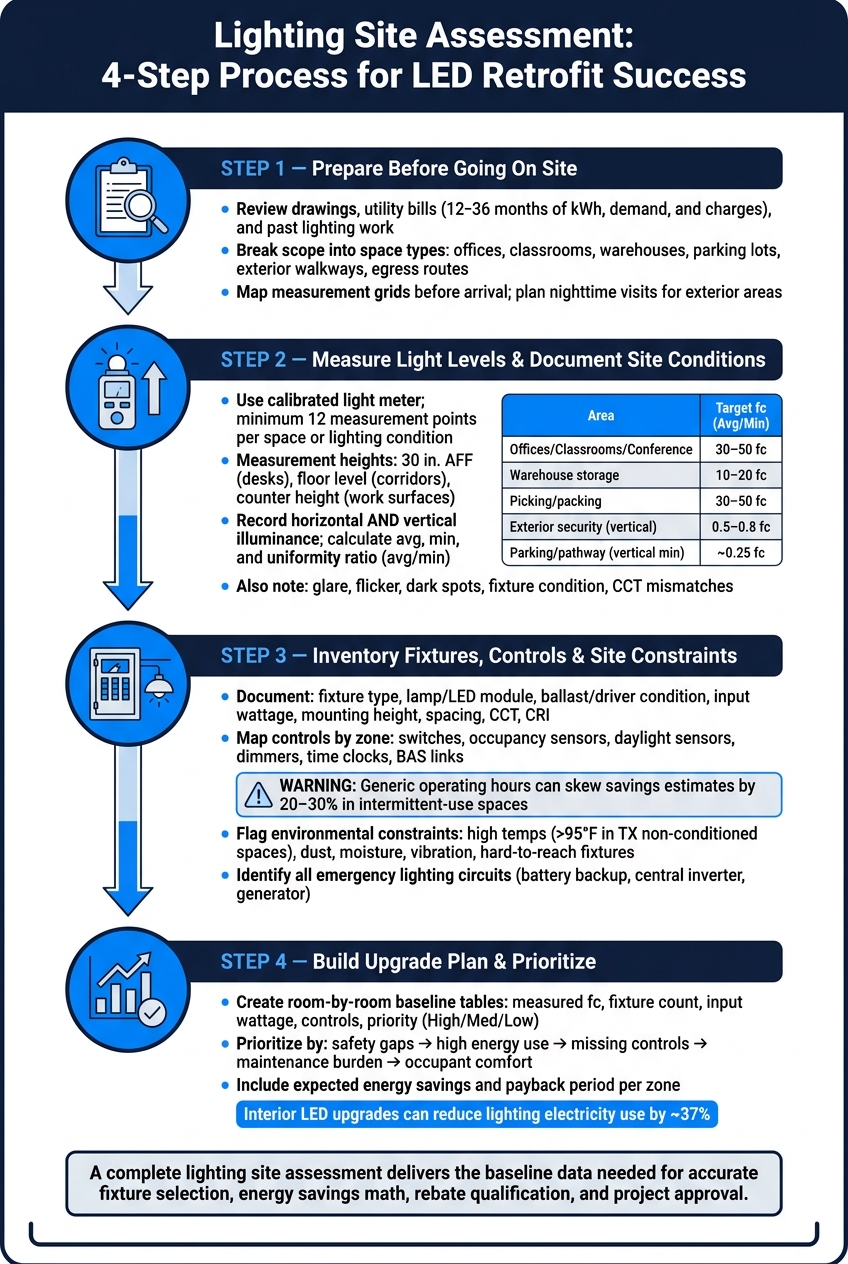
Lighting Site Assessment: 4-Step Process for LED Retrofit Success

Start the assessment at the desk, before the site visit. If you know more going in, you spend less time guessing once you're in the field.
Pull together the core documents first: floor plans, reflected ceiling plans, electrical as-builts, fixture schedules, panel schedules, and single-line diagrams. These show fixture locations, mounting heights, circuit groupings, and which panels serve each area.
Then match those drawings with 12 to 36 months of electric utility bills, including kWh, demand, and charges. This data can show seasonal swings and high-demand periods that may shape the upgrade plan. If you can, ask for interval data too. That helps you spot peak demand periods instead of relying on monthly totals alone.
Also review maintenance logs, prior audit reports, and complaint records. Work orders that mention repeated lamp failures, glare, flicker, dark zones, or failed controls often point straight to the spaces that need the closest look on site. They also help the team check whether the drawings still match what is actually installed. Use all of this to build your field checklist and measurement plan.
Not every space works the same way, so don't treat the whole building like one big lighting zone. Break the scope out by space type and function, such as offices, classrooms, warehouses, parking lots, exterior walkways, egress routes, and sports areas.
For each area, note the hours of use:
A gym used for evening events does not behave like a classroom that closes at 4:00 p.m. Getting those differences down before the visit helps the assessment match actual operating conditions and supports accurate fixture selection and payback calculations. It also tells you where and when to take readings.
Timing matters. Interior spaces with large windows, skylights, or clerestories should be measured when daylight is typical for normal use, and the outdoor light level should be recorded with each interior reading. For exterior areas like parking lots, walkways, and egress routes, nighttime measurements are usually needed. IES guidance recommends scheduling outdoor parking assessments after civil twilight so readings are not skewed by unwanted light.
Before the visit, map out measurement grids with fixed spacing in feet for each space so field readings stay consistent and repeatable. For interior rooms, a regular grid across the work plane is standard. For parking rows or loading aisles, evenly spaced points along centerlines and at the edges, where light tends to drop off, work well.
Keep the spacing, height, and method the same across similar spaces so results can be compared fairly. Standard measurement and verification guidance recommends at least 12 measurement points per distinct lighting condition or space type to produce reliable baseline data. Once the grid is set, the site visit can stay focused on readings and visible conditions.
This is where the field survey turns into baseline data you can actually use for LED design and energy-savings math. The setup doesn't need to be fancy, but it does need to be consistent. Use a calibrated light meter, measuring tape or laser, camera, and clamp meter to record illuminance, dimensions, photos, and actual wattage.
A few small habits matter here. Clean the sensor before each reading. Stand clear of the sensor so your body doesn't affect the result. Then wait until the reading settles before you write it down.
Keep measurement height and position the same from space to space. Use:
For each area, calculate the average, minimum, and uniformity ratio (avg/min) across the grid points. That uniformity ratio helps show whether the issue is uneven light distribution, not just a low average level.
Use that same steady approach outdoors too. Outside, vertical light and visual security can matter just as much as foot-candles.
Horizontal illuminance shows how well a task surface is lit. Vertical illuminance shows how well people, signs, and walls are lit. That's a big difference, and it's easy to miss if you're only checking horizontal levels. To take vertical readings, hold the meter sensor upright and point it toward the surface you're evaluating, like a corridor wall or exit sign. Readings at eye level - about 5 ft above finished floor or grade - are especially useful for wayfinding, face identification, and security.
The table below shows commonly referenced illuminance targets for U.S. commercial and institutional spaces.
| Space Type | Target (fc) | Notes |
|---|---|---|
| Open/private offices | 30–50 fc | Measured at desk height (30 in. AFF) |
| Conference rooms | 30–50 fc | Often with dimming capability |
| Classrooms | 30–50 fc | Measured at desk height |
| General warehouse storage | 10–20 fc | Floor level |
| Picking/packing areas | 30–50 fc | Task plane |
| Exterior security (vertical) | 0.5–0.8 fc | On faces; uniformity ratio ≤ 4:1 |
| Parking/pathway (vertical min.) | ~0.25 fc | In security camera zones |
Take exterior readings after dark and use the same grid points from the field plan. Also note glare, dark gaps between fixtures, and light spill. Photos help here, especially from both driver and pedestrian viewpoints.
Numbers alone won't tell the whole story. Fixture condition often explains why a space performs poorly.
From the occupant's point of view, record glare, shadows, flicker, and mismatched color temperature. Also flag color-quality problems, like mismatched CCT between fixtures in the same room or poor color rendering in spaces where color accuracy matters, such as healthcare exam rooms or retail displays.
Record fixture condition alongside those visual-comfort notes. Look for dirty lenses, cracked diffusers, corrosion, failed lamps, and driver failures, and estimate how much of the space is affected. That makes it easier to tell the difference between fixtures that need replacement and issues that may be fixed with cleaning, aiming, or controls.
After you measure performance, document the hardware behind it. Once light levels and condition issues are on paper, the next step is to build a complete record of what’s installed now. That record helps you confirm what can be replaced as-is, what needs rewiring, and what may need a different control setup.
For each area, document fixture type, lamp type or LED module, ballast or driver condition, actual input wattage, mounting height, spacing, and layout. If correlated color temperature (CCT) or CRI appears on the label, record that too. Keep the same level of detail for every room so fixture schedules and rebate forms line up with field conditions.
This gives the team a clear picture of which spaces can use like-for-like replacement and which ones need layout or control changes. Give each space a unique room or zone ID, then use that same ID on the fixture schedule, control map, and installation plan.
Next, map the controls that decide when those fixtures run.
Map controls by zone, not just by switch. For each space, record the number and location of switches, which circuits or fixture groups they control, occupancy sensor type and placement, and any daylight sensors, dimmers, time clocks, or building automation links.
Then compare that map to how the space is used in practice. Talk to staff. Ask whether occupancy sensors get overridden, whether cleaning crews run lights outside normal hours, and whether daylight zones stay fully on even when sunlight is available. Use verified class, event, and custodial schedules instead of assuming a standard operating day.
Generic hours can skew savings by 20–30% in intermittent-use spaces, and matched occupancy or daylight controls can cut lighting energy use by a meaningful amount. Base control settings on actual schedules so each space lines up with the way people use it. Many utility programs also require documented control upgrades to qualify for higher incentives.
After controls, check the site limits that can affect installation and product life.
Flag installation and maintenance constraints during the inventory. They affect fixture selection, labor, and commissioning. In Texas facilities, high ambient temperatures are a common issue. Non-conditioned warehouses, school gyms, and industrial spaces can regularly go above 95°F, so note whether HVAC is intermittent or absent and flag those spaces for high-temperature-rated luminaires.
Also document dust, moisture, vibration, and access limitations. A wood shop or agricultural facility may need sealed optics and the right IP ratings. A municipal pump station near heavy machinery may need vibration-rated drivers. Flag hard-to-reach fixtures early so the plan includes lifts, safety steps, and phased access.
Finally, identify every luminaire that is part of the emergency lighting system. Record whether each emergency luminaire is on a life-safety circuit, battery backup, central inverter, or generator power, and measure light levels under both normal and emergency power. Those details help prevent code issues and gaps in emergency lighting.
Take the fixture inventory and control map, and turn that field data into a clear upgrade summary. The goal is simple: build room-by-room tables that owners and facility teams can scan fast and use to compare conditions across the site.
Each table should pull together the light levels, fixture counts, operating hours, controls, and site constraints gathered in Sections 2 and 3. Keep the format the same in every space. That way, people can compare one room to the next without stopping to decode the layout.
| Area ID | Measured Light Level (fc) | Fixture Count | Input Wattage | Controls | Priority |
|---|---|---|---|---|---|
| Room/zone identifier | Avg, min, uniformity ratio | Total per space | Actual per fixture | Switch, sensor, dimmer, time clock | High / Medium / Low |
A table like this helps turn a pile of notes into something people can act on. Instead of jumping between photos, sketches, and meter readings, the team gets one clear view of what each room has now and where the biggest issues sit.
Once the baseline table is done, rank each space by risk, savings potential, and control gaps. Start with rooms that have poor light levels, high energy use, or missing or weak controls. Then move high-maintenance areas and frequent-failure zones closer to the top. Spaces where better light can improve work quality and occupant comfort should also move up the list.
For each area you rank, include the expected energy savings and payback period. That gives decision-makers a simple way to compare top-priority zones first, instead of treating every room the same.
A solid lighting site assessment follows a clear sequence: prepare before you arrive, measure conditions the same way in each space, inventory the full system including controls and constraints, and organize the findings into a structured plan. Each step depends on the one before it. Skip one, and planning mistakes become much more likely.
Once the plan is ranked, use it to guide scope, budget, and scheduling.
A lighting site assessment is the starting point for a successful LED retrofit. It gives you a clear picture of your current energy use, fixture types, and electrical setup so you can set realistic energy-saving goals and estimate ROI.
It also helps spot waste, such as poor fixture placement, glare, or old ballasts. On top of that, it supports compliance with Texas safety and energy rules, helps prevent installation mistakes, and may be required if you plan to apply for utility rebates or other incentives.
A lighting site assessment usually relies on a small set of tools to measure light levels, record current conditions, and check energy use.
That often includes:
It’s a pretty straightforward toolkit, but each piece does a different job. One tool tells you if a space is too dim or too bright. Another helps confirm what kind of electrical system you’re working with. And the software side ties it all together by modeling lighting layouts and checking whether the project meets code.
A site assessment helps tighten rebate and payback estimates because it builds an accurate baseline for your facility’s current energy use, operating hours, and fixture performance. It also records your lighting inventory and electrical setup, which makes projected savings easier to calculate with more confidence.
That information is often required for utility rebate applications, including pre-approval and savings verification. Texas Lighting Consultants supports this process with detailed assessments and rebate application assistance.

We’re a HUB-certified Texas lighting company specializing in surveys, calculations, and installations for government and contractor projects.
© 2025-26 | Texas Lighting Consultants | All Right Reserved.